The AI Value Realisation Index
A demand-side lens on the AI bubble debate: how much of the AI value enterprises expect can be verified as real, measured results.
Coming next · a quarterly tracker of the index and a public log of any methodology changes - so every move, and every method tweak, is on the record.
What this measures
The AI Value Realisation Index is a single score from 0 to 100. It measures how much of the AI value that large companies claim can be verified in what they disclose. It is an aggregate across every company in the S&P 500 and FTSE 100. Each company is scored on its own, and the index combines those scores. The score falls into four bands: Talking (0 to 20), Emerging (20 to 40), Proven (40 to 60), and Realised (60 to 100).
The terms
Ladder Level (0 to 5). How strong one piece of disclosed proof is. Level 0, no material AI discussion. Level 1, AI named as a priority or a future goal. Level 2, a live deployment, but only usage, adoption or spend to show for it. Level 3, the first real, quantified result. Level 4, a defined metric, such as cost or margin, that can be followed over time. Level 5, AI value broken out as its own KPI or P&L line. It is separated from the rest of the business and reported consistently, quarter after quarter, so an outsider can track the same figure over time. Aspirational claims and future targets sit at Level 1, and pilots are capped at Level 2, so neither counts as proof. Proof is drawn from earnings calls, 8-K releases, primary press and SEC filings, and the strongest evidence usually sits in calls and press rather than 10-Ks. Coverage is the S&P 500, updated quarterly, and the FTSE 100, updated semi-annually, each labelled by its reporting period.
Proven Value (0 to 100). A company's score. We take its best Ladder Level in each of three areas: cost, revenue and customer. We add the three Levels and scale the total to 100. Only Level 3 and above counts. A company has to prove value in more than one area to score highly. This is the only place the three areas are used.
Talk Score (0 to 1). How densely a company raises AI, across its SEC filings (10-K and 10-Q) and earnings calls. We count AI mentions relative to how much the company publishes, and how often AI comes up on its calls. We exclude risk-factor boilerplate, and theme and tag what remains. Those counts are put through a saturating curve that lands every company between 0 and 1. No AI talk scores 0. Heavy AI talk approaches 1, with diminishing returns near the top. The curve is fixed, so scores stay comparable across quarters even as AI language spreads. Talk Score is used only as a weight, in step 2 below.
Substantiation. The ratio of a company's evidenced claims against all AI claims. It is a companion figure. It is not part of the index and it is not a multiplier. It sets the size of each bubble on the Talk versus Proof chart and appears on the rankings tables.
How the index is built
Step 1. Score each company, using the Proven Value rule above.
Step 2. Combine company-level Proven Value scores into one aggregate number. Each company's Proven Value is weighted by its revenue multiplied by its Talk Score. A large company that raises AI constantly counts for more than a small, quiet one. We add up the weighted scores and divide by the total weight. This quarter the result is 13.5, in the Talking band.
Why you can trust it
Every company, filing, earnings call and press claim we read is in the underlying data. If an announcement seems to prove more, look the company up and see how its disclosure scored. If something is missing, tell us and we will weigh it next quarter.
Go deeper: Rankings · Company analysis · AI Claim Finder · About
Subscribe for the latest
Weekly analysis and new index reports the moment they publish.
The Proof Gap: AI talk vs. disclosed proof
Share of companies that name a deployment in their filings, reach a quantified result (Proof Level 3), and a trackable result (Proof Level 4)
Disclosure from company filings, 10-K and 10-Q. Quantified impact and proof levels from earnings calls, 8-K releases and web research.
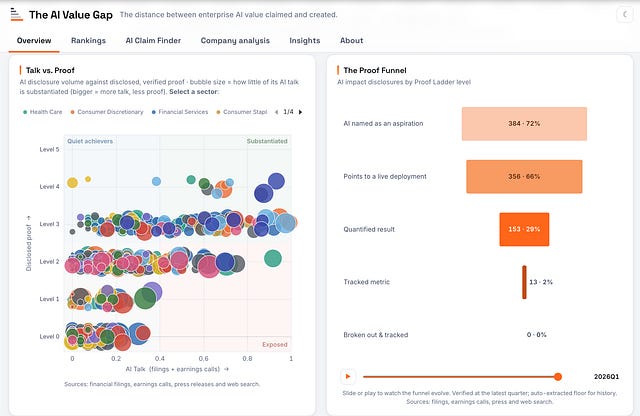
Talk vs. Proof
AI disclosure volume against disclosed, verified proof. Bubble size shows how little of a company's AI talk is substantiated: bigger means more talk and less proof. Select a sector:
Sources: financial filings, earnings calls, press releases and web search.
The Proof Funnel
AI impact disclosures by Proof Ladder level
Slide or play to watch the funnel evolve. Verified at the latest quarter; auto-extracted floor for history. Sources: filings, earnings calls, press and web search.
What kind of proof?
Every disclosed proof point, grouped by the value domain it proves: cost, revenue or customer. Each bar shows the specific levers within that domain.
Proven Value - Rankings
Proven Value (0–100) is the proof Level a company reaches in each of three areas: cost, revenue and customer, summed and scaled to 100. Only realised outcomes count, Level 3 and above. A score of 0 means no realised outcome disclosed. Substantiation is a company's disclosed proof set against how much it claims. A low figure means talk runs ahead of proof. Ranked by Proven Value. Click a company to open its analysis.
WEIR GROUP PLC WEIR
Industrials · Proven Value 27/100 · Emerging
Top achievement: Motion Metrics AI subscription achieves 24% annualised recurring-revenue growth, 88% conversion
Weir Group holds a Proven Value of 27, drawn entirely from the revenue domain, where it reaches a tracked-metric tier; with no disclosed results in cost or customer, this is a narrow rather than weak evidence base, concentrated in a handful of software initiatives. Its disclosure is heavier in filings than on earnings calls, spanning product innovation, capability building, cost-productivity and governance themes, including the Motion Metrics machine-vision offering and NEXT condition-monitoring. The strongest quantified figure is roughly 24% annualised recurring-revenue growth, alongside 88% recurring conversion.
How much of WEIR GROUP PLC's AI talk is backed by disclosed, verified proof — from The AI Value Gap index of the S&P 500 & FTSE 100.
Subscribe for the latest
Weekly analysis and new index reports the moment they publish.
Explore what companies claim AI delivers
Build a question from the lenses below. Every figure is a deduplicated, sourced claim drawn from filings, earnings calls and 8-K releases. Pick a unit to see the spread of the numbers.
Insights
Essays and analysis behind the index - published on Substack.
No.35: AI talk is cheap, AI proof is scarce
The market pays no visible premium for companies that can prove AI works. Talk and proof trade at the same price.
Read on Substack →
Q1 2026 AI Swimsuit Report: Talk Dominates
The first quarterly report. The index opens at 13.5/100 - "Talking": across 536 large US and UK companies, only 29% can prove a single realised AI outcome, and claim-by-claim just 8% is backed.
Read on Substack →
No.33: Introducing the AI Swimsuit Index
A study of S&P 500 companies showing that when the AI tide goes out, only one in five has the financial proof to match the story.
Read on Substack →The AI Value Gap
The distance between enterprise AI value claimed and created.
Why it exists
Every large company now says it is powered by AI, but far fewer can show a hard number that proves it pays.
The whole AI-bubble question turns on that demand-side gap. It comes down to whether enterprises are turning AI spending into real value, and how fast.
Yet almost all of the debate runs on the supply side: hyperscaler capex, chip sales, valuations. Very little measures the value actually landing on the ground.
The AI Value Gap measures that missing side. It tracks verifiable value realisation, company by company, from what those doing the work disclose. The aim is simple: a gauge of where AI value is starting to emerge, and a benchmark for the initiatives large companies are running. For each one it sets what can be proven against what is claimed, and separates the signal from the noise.
"Only when the tide goes out do you discover who's been swimming naked." Our flagship quarterly report's name nods to Warren Buffett: AI is the rising tide, and the Value Realisation Index the measure for when it goes out.
About the author
Amin Mrini
Senior AI operator · Author
A senior AI operator in B2B information services, Amin works at the front line of enterprise AI and data strategy, agentic products and large-scale transformation. With a background in strategy consulting and an HEC Paris degree, he is the author of The AI Value Gap on Substack, a weekly analysis of AI progress beyond the hype, focused on enterprise execution and real-world impact. He built the AI Value Realisation Index as a gauge for the gap between AI ambition and reality.
Advisor · Methodology & Framework
Marcus Weldon
Former President, Bell Labs · Former CTO, Nokia
As President of Bell Labs, and Chief Technology Officer of Nokia, Alcatel-Lucent and Lucent Technologies, Marcus built a track record of turning pioneering research into product development and business strategy. He studied chemistry and computer science as an undergraduate before receiving his PhD in physical chemistry from Harvard and joining Bell Labs as a research scientist studying semiconductor surface interactions. His career evolved as he undertook a number of leading technology innovation roles over 20 years in the telecom sector, before founding his own technology consulting company. He recently served as the Neil Armstrong Visiting Professor at Purdue, lecturing on AI, and is currently the Newsweek senior contributing editor for AI. But he spends the majority of his time acting as an AI advisor to pioneering companies and organisations, including working with Amin on the AI Value Gap's methodology and scoring framework.